Try Again
Review Lesson
Math6.org
Stem-and-Leaf Plots Page
Stem-and-Leaf Plots Lesson Quiz
Type or select your answer, then press "Check".
After a correct answer, click the => to advance to the next question.
Show all questions
<=
=>
What is the smallest value shown in the stem-and-leaf plot on the right?
Check
?
10
?
Study
What is the greatest value shown in the stem-and-leaf plot on the right?
Check
?
52
?
Study
What is the median of the data shown in the stem-and-leaf plot on the right?
Check
?
30
?
Study Median
?
Study Stem-and-Leaf
What is the mode of the data shown in the stem-and-leaf plot on the right?
Check
?
22
?
Study Mode
?
Study Stem-and-Leaf
What is the
range
of the data shown in the stem-and-leaf plot on the right?
Check
?
42
?
Study Range
?
Study Stem-and-Leaf
Which of the following is the most reasonable reason for having no leaves with the 3 and 4 stem?
?
The data is incorporated into the 2 Stem.
?
The data is missing.
?
There was no data in the 30's or 40's.
?
The data was added to make 54.
What number is an outlier for this data set?
Check
?
54
?
Study Outliers
?
Study Stem-and-Leaf
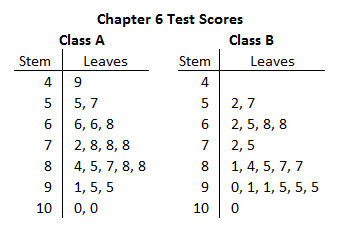
Which class has the greater mode?
?
Class A
?
Class B
Which class has a data range of 48?
?
Class A
?
Class B
What is the lowest data value shown?
Check
?
49
?
Study
What is the highest data value shown?
Check
?
100
?
Study
Which class has a mean of 79?
?
Class A
?
Class B
What is the median of Class A?
Check
?
81
?
Study Median
?
Study Stem-and-Leaf
What is the median of Class B?
Check
?
84.5
?
Study
?
Study Stem-and-Leaf
What type of graph would be the best graph to use to display this data?
?
Bar Graph
?
Double Bar Graph
?
Double Line Graph
?
Line Graph
OK
Top
© 2010 Norm Mitchell. All Rights Reserved |
Legal
|
Privacy
|
COPPA
|
Site Map
|
Search
|
Contact
|
Help