Line Graphs Lesson Quiz
Type or select your answer, then press "Check".
After a correct answer, click the => to advance to the next question.
After a correct answer, click the => to advance to the next question.
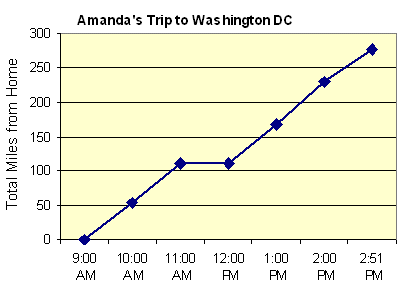
 Amanda and her family drove to Nashville TN. Amanda kept track of the data shown on the right. What would be the best reason for Amanda to choose a line graph for this data?
- The data shows the relationship between two variables.
- The data shows a comparison of one value against another.
- The data shows changes over time.
- The data shows the percentage of the trip completed by hour.
 Amanda wants to make a line graph of the data in the table on the right. Which interval would be the best choice to create a fair graph?
- 2 hours
- 10 miles
- 100 miles
- 1000 miles
 Amanda has decided to make a line graph out of the data table on the right. Which of the following should she include?
- A legend to help the viewer tell the difference between the variables.
- A brief explanation of why the family was going to Washington DC.
- Additional data from another family's trip.
- A label for the Y axis as "miles from home"
 Between which hours did Amanda stop?
- 10:00 - 11:00
- 11:00 - 12:00
- 12:00 - 1:00
- They didn't stop until they got there.
 About how far did Amanda's family travel between 9:00 and 10:00?
- 50 miles
- 100 miles
- 150 miles
- 200 miles
 About how far did Amanda's family travel between 9:00 and 11:00?
- 50 miles
- 125 miles
- 150 miles
- 175 miles
 About how far was the total trip?
- 250 miles
- 275 miles
- 900 miles
- 1000 miles
 Between which hours did the Boy Scouts stop?
- 10:00 - 11:00
- 11:00 - 12:00
- 12:00 - 1:00
- They didn't stop until they got there
 During which hour did the boy scouts travel the greatest distance?
- 9:00 - 10:00
- 10:00 - 11:00
- 11:00 - 12:00
- 1:00 - 2:00
 About how far had Amanda's family traveled after 3 hours?
- 250 miles
- 100 miles
- 175 miles
- There isn't a 3:00 on the graph.
 During which month did sales decline?
- March
- April
- May
- February
 What type of trend does this graph show?
- Increasing
- Decreasing
- Floating
- Inverse
 About how many more Drool Catchers were sold in March than January?
- 7000
- 6000
- 5000
- 4000
 About how many more Drool Catchers were sold in April than February?
- 10,000
- 6,000
- 4,000
- 2,000
 Approximately how many Drool Catchers were sold during the 5 months shown?
- 9000
- 10,000
- 27,000
- 28,000
- Here's a question I couldn't resist putting in! (sorry)
 Assuming these figures are exact, what was the average (mean) number of Drool Catchers sold over the 5 month period?
- 5
- 5250
- 5400
- 5600