Try Again
Review Lesson
Math6.org
Bar Graphs Page
Bar Graphs Lesson Quiz
Type or select your answer, then press "Check".
After a correct answer, click the => to advance to the next question.
Show all questions
<=
=>
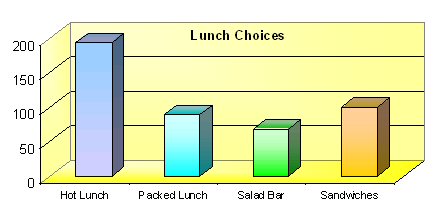
Which lunch was chosen the most often?
?
Hot Lunch
?
Packed Lunch
?
Salad Bar
?
Sandwiches
Which lunch was chosen the least often?
?
Hot Lunch
?
Packed Lunch
?
Salad Bar
?
Sandwiches
What is the interval used on this graph?
?
50
?
0 - 200
?
4
?
Study Intervals
What is the scale used on this graph?
?
50
?
0 - 200
?
4
?
Study Scale
Compare the packed lunch choice with the salad bar choice.
?
About 40 - 50 fewer packed lunches
?
About 40 - 50 fewer salad bars
?
About 20 - 30 fewer packed lunches
?
About 20 - 30 fewer salad bars
Which of the following would be the best interval for this data?
?
25
?
40
?
50
?
10
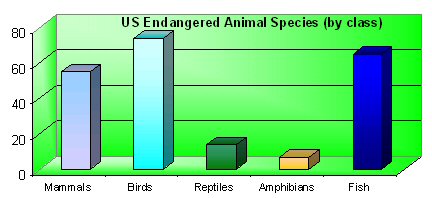
Which class of animals has the greatest number of endangered species?
?
Mammals
?
Birds
?
Amphibians
?
Fish
Which class of animals has the fewest number of endangered species?
?
Mammals
?
Reptiles
?
Amphibians
?
Fish
About how many more species of birds are endangered than species of mammals?
?
10
?
20
?
30
?
40
Which class of animal has about 10 more endangered species than mammals?
?
Birds
?
Reptiles
?
Amphibians
?
Fish
What is the scale used on this graph?
?
0 - 80
?
10
?
20
?
80
What is the interval used on this graph?
?
0 - 80
?
10
?
20
?
80
OK
Top
© 2010 Norm Mitchell. All Rights Reserved |
Legal
|
Privacy
|
COPPA
|
Site Map
|
Search
|
Contact
|
Help